SAM文件中的soft clipping和hard clipping

clipped alignment因为着在比对过程中,并没有用到全部的read的序列,read两段的序列被截取了(clip or trim)。如下表示,即为clip alignment。

Alignment:

Read:          ACGGTTGCGTTAA-TCCGCCACG
|                           ||||||||| ||||||
Reference: TAACTTGCGTTAAATCCGCCTGG

与clipped alignment对应的是spliced alignment,即read的中间没有比对到而两段比对上了。对应的表示如下:

Alignment:

Read:          ACGGTTGCGTTAAGCTCATCCGCCACG
|                 |||||||||||||         |||||||||
Reference: ACGGTTGCGTTAA…..TCCGCCACG

clip alignment对应的CIGAR表示有两种S (soft clip) 和H (hard clip)。 BWA提到If the read has a chimeric alignment, the paired or the top hit uses soft clipping and is marked with neither 0x800 nor 0x100 bits. All the other hits part of the chimeric alignment will use hard clipping and be marked with 0x800 if option “-M” is not in use, or marked with 0x100 otherwise.

即如果发现嵌合比对,最好的比对top hit标记为soft clipping,其余的则标记为hard clipping。

如果是hard clip,则截取的部分不会在SAM文件对应的read中出现 (clipped sequences not present in SEQ),如果是soft clip (clipped sequences present in SEQ),则会出现。

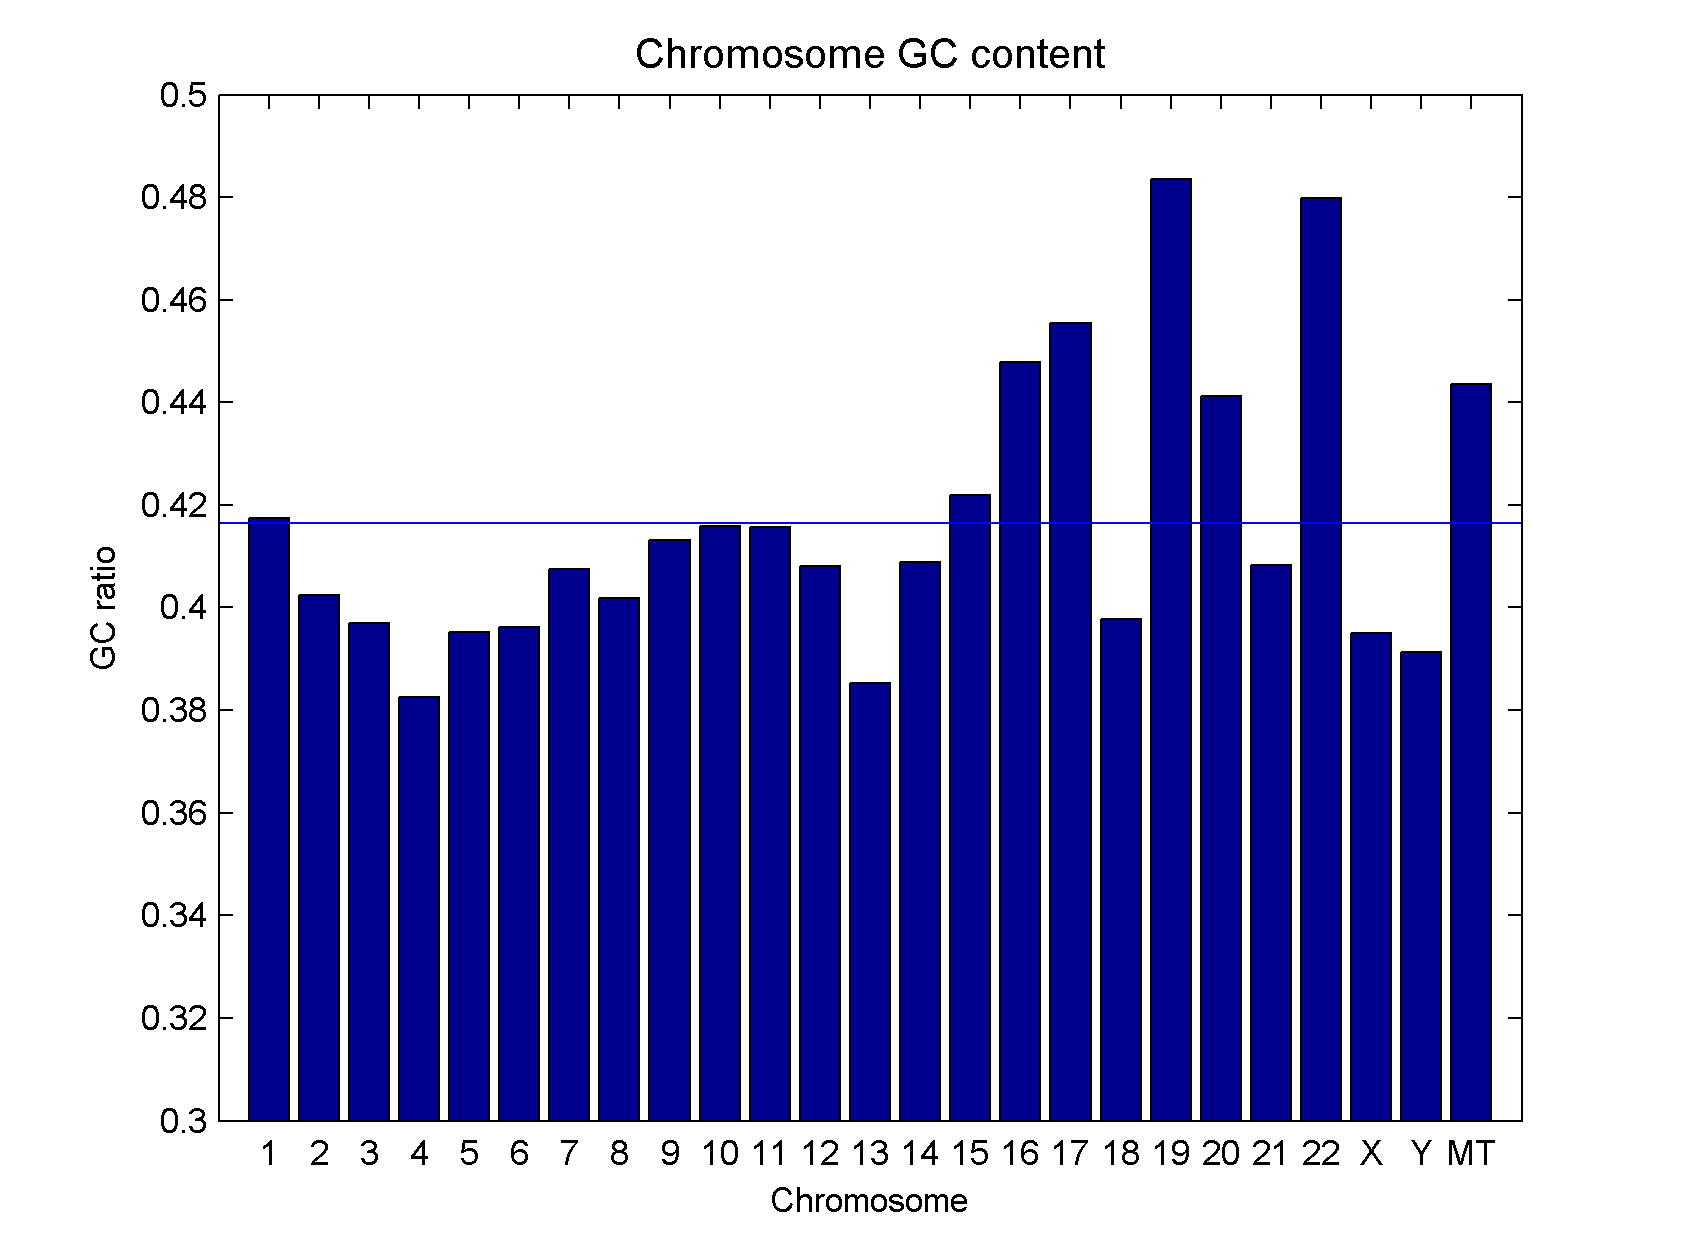
人基因组每条染色体的GC含量GC content of human chromosomes

The GC content is the molar ratio of guanine+cytosine bases in DNA. The human genome is a mosaic of GC-rich and GC-poor regions, of around 300kb in length, called isochores. GC content is an important factor in many experiments and bioinformatic analysis. This is especially true for next-generation sequencing where the DNA being sequenced has gone through multiple rounds of PCR amplification.

高通量质控统计软件包Rqc--Quality Control Tool for High-Throughput Sequencing Data

在得到下机数据之后,首先会对下机数据进行质控,并对碱基质量碱基分布等进行统计和绘图,得到质控报告。大家常用的质控软件有Faxtx tookit,fastqc,Trimmomatic 等,但出图要么是自己根据统计结果自己画图要么是用fastqc的图。个人觉得fastqc的图有点土,于是找到了Rqc包,顾名思义R quality control。发现国内没有人介绍该包,在此向广大人民群众推荐该包。

Rqc包的介绍网址在http://www.bioconductor.org/packages/release/bioc/html/Rqc.html

有两种安装方式

一种是通过bioconductor

1
source("http://bioconductor.org/biocLite.R")

如果下载包的网速非常慢,请更换镜像chooseBioCmirror()

1
biocLite("Rqc")

另一种方式是通过github

install.packages("devtools")
library(devtools)
install_github("labbcb/Rqc")

Rqc包自带测试数据用于测试Rqc:
library(Rqc)
folder rqc(path = folder, pattern = ".fastq.gz")

结果输出如下:

read质量分布Per Read Mean Quality Distribution of Files

![](/wp/f4w/2020/2016-01-10-Rqc-intro/Per Read Mean Quality Distribution of Files.png)

PCA主成分分析和NMF非负矩阵分解感悟

以前只了解PCA分析,这两天看到有用非负矩阵分解NMF提取肿瘤突变特征的,遂了解了下NMF。我关注的是如何理解这两种分析,实现的话,可以找相应的R包Python包来做。

样本数:M 属性数:N 如果属性N过多话,数据存储占地方,直接分析N个属性也看不出什么,所以要降维,要研究重点。

维数由N降到X,比如降到两维

PCA分析通过分解协方差矩阵,找的是N个属性中对方差贡献靠前的X个属性,即能解释大部分variance。 样本1=0.5属性1N1+0.2属性1N4 样本2=0.5属性1N2+0.2属性2N4

NMF分析找的是X组包含对N个属性的加权值(或系数)的向量(每个属性的分解成由X个特征表示), MN=MX x XN,MN为原始矩阵,MX为基矩阵(每一列对应X组特征的基值),XN为系数矩阵(每一行为一组特征)。最终还是利用了N个属性,但是利用的X组特征,每一组特征包含不同权重的N个属,X组特征共同对原始值有贡献(贡献的强度不同而已)。 样本1=0.5特征a+0.2特征b+0.3特征c 样本2=0.1特征a+0.2特征b+0.7特征c

PCA主要用于降维 NMF应用于非负的矩阵,一是可以降维,二还可以提取特征,看哪些特征贡献大。

参考阅读: http://www.cnblogs.com/zhangchaoyang/articles/2222048.html http://blog.csdn.net/acdreamers/article/details/44663421