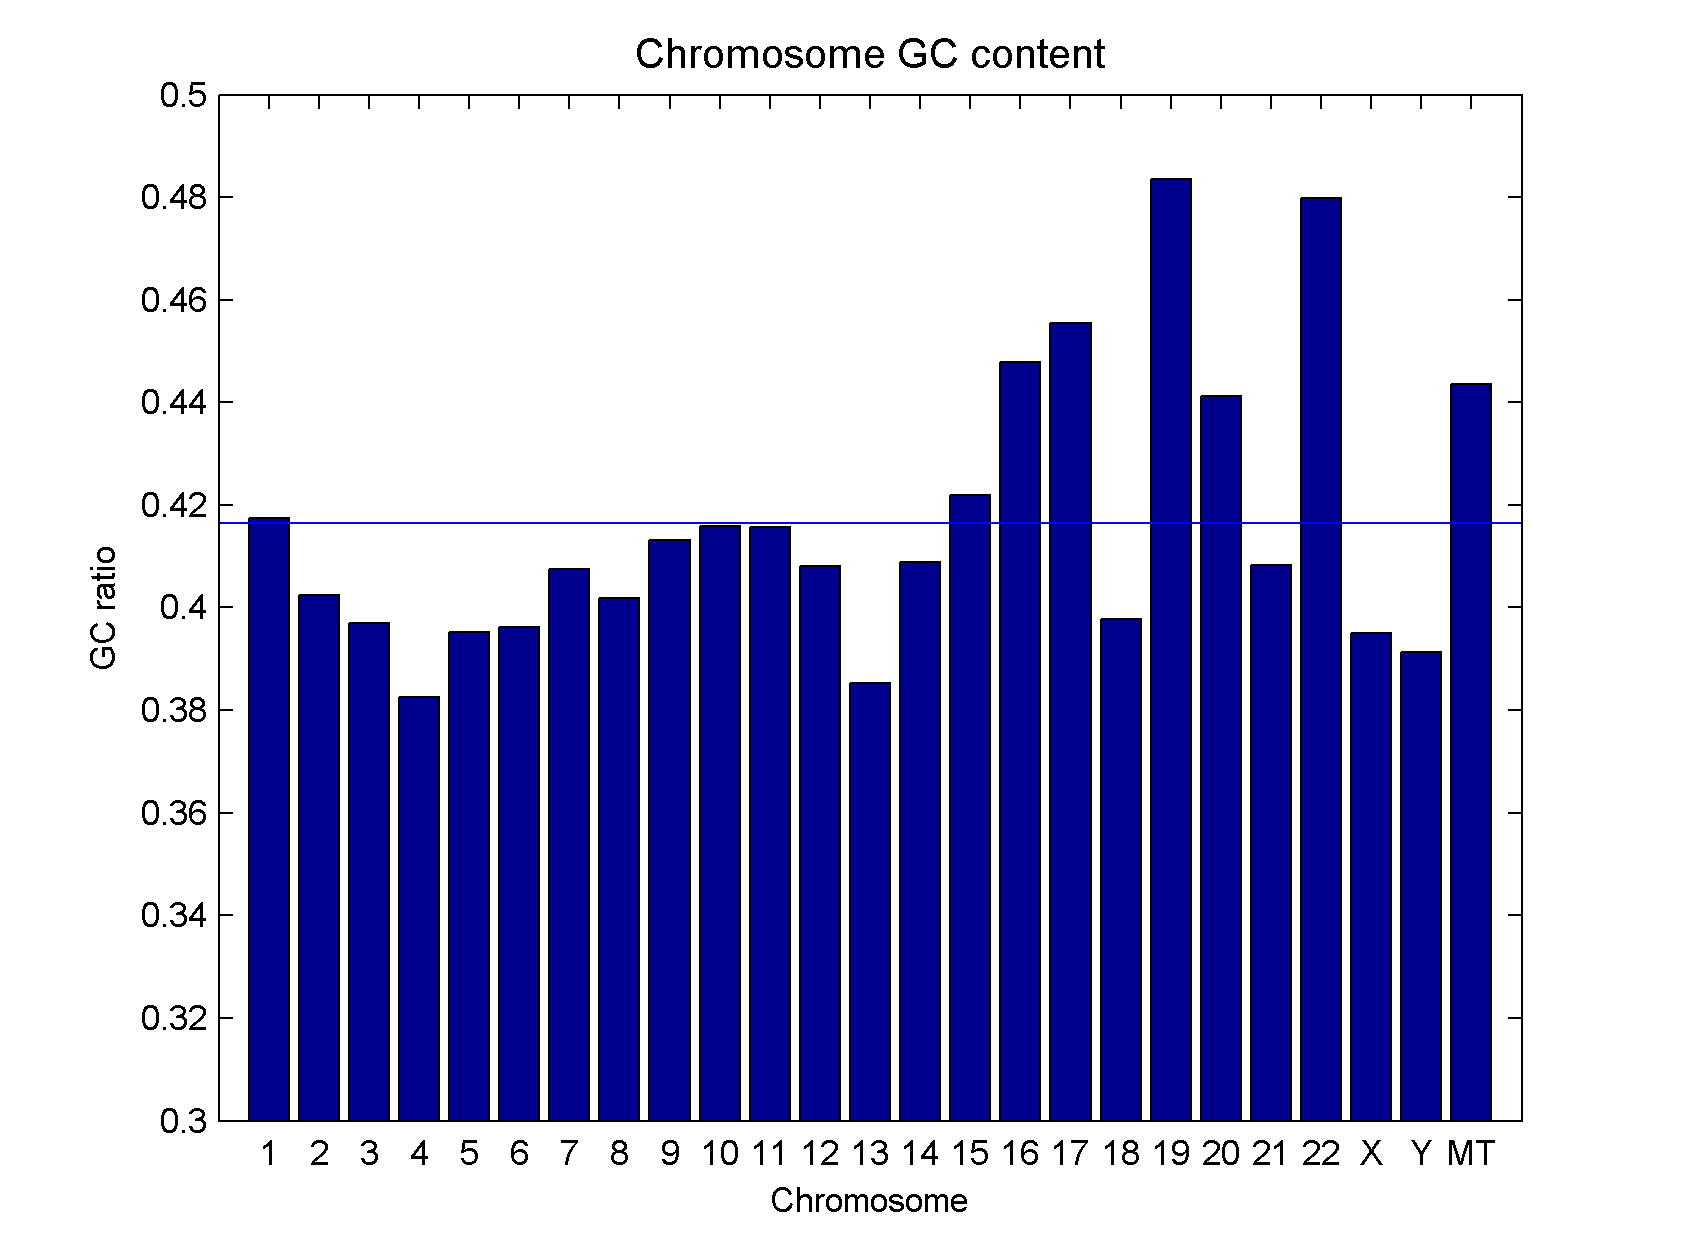
人基因组每条染色体的GC含量GC content of human chromosomes
文章目录
The GC content is the molar ratio of guanine+cytosine bases in DNA. The human genome is a mosaic of GC-rich and GC-poor regions, of around 300kb in length, called isochores. GC content is an important factor in many experiments and bioinformatic analysis. This is especially true for next-generation sequencing where the DNA being sequenced has gone through multiple rounds of PCR amplification.

- 1 0.417439
- 2 0.402438
- 3 0.396943
- 4 0.382479
- 5 0.395163
- 6 0.396109
- 7 0.407513
- 8 0.401757
- 9 0.413168
- 10 0.415849
- 11 0.415657
- 12 0.40812
- 13 0.385265
- 14 0.408872
- 15 0.42201
- 16 0.447894
- 17 0.455405
- 18 0.39785
- 19 0.483603
- 20 0.441257
- 21 0.408325
- 22 0.479881
- X 0.394963
- Y 0.391288
- MT 0.443626 The common way to reduce the GC bias in data analysis is to basically
- calculate to GC ratio (number of G/C bases / number of bases) in the region of interest (ROI) being measured
- find average value measured (a) across the genome in all regions with this ratio
- normalize the value measured in the ROI (m) with this value: m/a More details on the GC bias in next-gen sequencing is described by Benjamini and Speed here: " The bias is not consistent between samples; and there is no consensus as to the best methods to remove it in a single sample. (…) It is the GC content of the full DNA fragment, not only the sequenced read, that most influences fragment count. This GC effect is unimodal: both GC-rich fragments and AT-rich fragments are underrepresented in the sequencing results. This empirical evidence strengthens the hypothesis that PCR is the most important cause of the GC bias."
Ref: http://blog.kokocinski.net/index.php/gc-content-of-human-chromosomes?blog=2
文章作者 zzx
上次更新 2016-01-10
