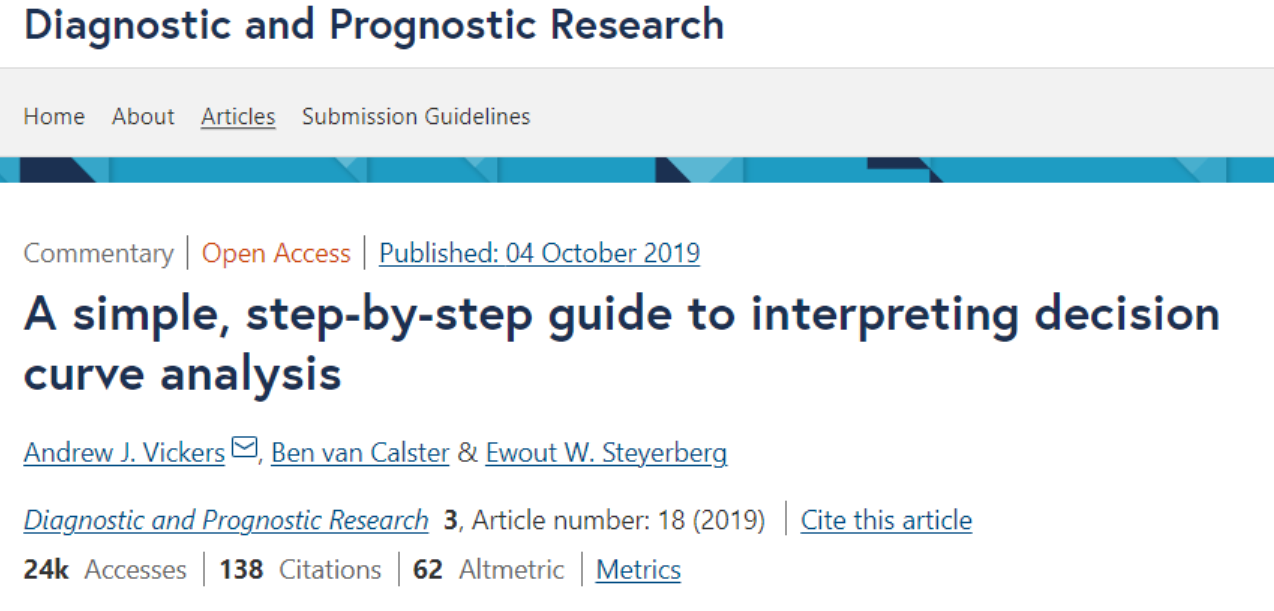
朋友问如何解读决策曲线分析,正好我也顺便学习一下,看到这篇文章[A simple, step-by-step guide to interpreting decision curve analysis](A simple, step-by-step guide to interpreting decision curve analysis),这篇文章引用也100多了。
[TOC]
Abstract
背景
决策曲线分析是一种评估预测模型和诊断测试的方法,该方法在 2006 年的出版物中引入。 现在文献中普遍报道了决策曲线,但对其含义的理解仍然存在广泛的误解和混淆。
评论总结
在本文中,我们一步一步的解读决策曲线分析,并回答了有关该方法的一些常见问题。 我们认为,解释决策曲线的许多困难可以通过将 y 轴重新标记为“收益”并将 x 轴重新标记为“偏好”来解决。 如果模型或测试在一系列临床合理偏好中具有最高水平的益处,则可以推荐用于临床使用。
结论
如果读者和作者遵循一些简单的指导方针,决策曲线很容易理解。
引言
决策曲线分析是一种评估预测模型和诊断测试的方法,由 Vickers 和 Elkin 在 2006 年的 Medical Decision Making刊物上提出。该方法试图克服传统统计指标的局限性,例如区分和校准,因为它们不能直接提供临床价值信息以及完整决策分析方法,这些方法不适用于常规生物统计学实践。
简而言之,与治疗所有患者或不治疗患者的默认策略相比,决策曲线分析计算一个或多个预测模型或诊断测试的临床“净收益(net benefit)”。净收益是基于一系列阈值概率(0-1)计算的。
阈值概率(threshold probability)定义为需要进一步干预的疾病的最小概率,我们可以理解为风险概率。
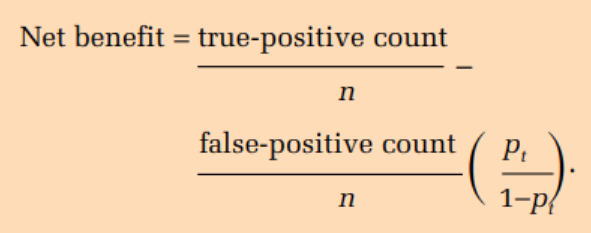
净收益(net benefit) = sensitivity × prevalence – (1 – specificity) × (1 – prevalence) × w (这个公式多了prevalence)
对于给出疾病预测概率 p̂ 的预测模型,在特定的pt阈值下,w是比值比odds,等于p̂/(1-p̂),阳性样本的 p̂ ≥ pt,进而可以计算灵敏度和特异性。净收益不同于判别和校准等准确度指标,因为它包含了基于模型或测试做出的决策的后果。有关决策曲线分析背景的更多信息,参阅 Vickers 等人。
06年文章中简单的公式没有prevalence,如下