GOdata = new(“topGOdata”, ontology = “MF”, allGenes = geneList,annot = annFUN.gene2GO, gene2GO = geneID2GO)
利用topGO进行分析,最重要的是构建topGO对象,构建topGO需要两个参数:
1,topGO需要基因和GO号的对应关系
2,基因列表,用来标记背景基因(所有基因)及差异基因
一,获取ensembl和GO号的对应关系: geneID2GO
如果你有现成的gene id和go id的对应关系,文件格式为
1
|
gene_ID制表符GO_ID1, GO_ID2, GO_ID3, ...
|
每行,则可以利用readMappings读取该文件(topGO包里面的函数)。
而我有一个cuffdiff的结果文件gene_exp.diff,用的是ensembl的注释GFF文件。首先需要获得ensembl和GO的对应关系,这里利用biomaRt包(前面的文章中有讲,这里不详细介绍)。
1
2
3
4
5
6
7
8
|
library(biomaRt)
genes = useEnsembl(biomart="ensembl",dataset="hsapiens_gene_ensembl")
# 得到go信息和gene
gene2goInfo <- getBM(attributes=c('ensembl_gene_id','go_id','entrezgene','name_1006','go_linkage_type','namespace_1003'), mart = genes)
# 过滤
gene2goInfo=gene2goInfo[gene2goInfo$go_id != "", ]
# 上述是一个gene对应一个go id,需要合并为一个gene对应多个go id,利用by函数(神器)
geneID2GO = by(gene2goInfo$go_id, gene2goInfo$ensembl_gene_id, function(x) as.character(x))
|
geneID2GO是符合topGO要求的,gene2goInfo和geneID2GO的格式如下
 1
 2
 3
 4
 5
 6
 7
 8
 9
10
11
12
13
14
15
16
17
18
19
20
21
22
23
24
|
> head(gene2goInfo)
  ensembl_gene_id      go_id entrezgene                         name_1006
3 ENSG00000281614 GO:0005886       3635                   plasma membrane
4 ENSG00000281614 GO:0005829       3635                           cytosol
5 ENSG00000281614 GO:0005515       3635                   protein binding
6 ENSG00000281614 GO:0007165       3635               signal transduction
7 ENSG00000281614 GO:0005856       3635                      cytoskeleton
8 ENSG00000281614 GO:0050852       3635 T cell receptor signaling pathway
  go_linkage_type     namespace_1003
3             IEA cellular_component
4             TAS cellular_component
5             IPI molecular_function
6             TAS biological_process
7             IEA cellular_component
8             TAS biological_process

> head(geneID2GO)
$ENSG00000000003
[1] "GO:0004871" "GO:0005515" "GO:0005887" "GO:0070062" "GO:0007166"
[6] "GO:0043123" "GO:0039532" "GO:1901223"

$ENSG00000000005
[1] "GO:0016021" "GO:0005737" "GO:0005515" "GO:0005635" "GO:0016525"
[6] "GO:0001886" "GO:0001937" "GO:0071773" "GO:0035990"
|
二,构建基因列表:geneList
1
2
3
4
5
6
7
8
|
diff=read.table("./gene_exp.diff",sep="t",header=TRUE)
# 差异表达基因
interesting_genes=factor(diff[diff$significant=="yes",]$gene_id)
# 所有基因
all_genes <- diff$gene_id
# 构建基因列表
geneList <- factor(as.integer (all_genes %in% interesting_genes))
names(geneList)=all_genes
|
三,构建topGO对象
 1
 2
 3
 4
 5
 6
 7
 8
 9
10
11
12
13
14
15
16
17
18
|
source("https://bioconductor.org/biocLite.R")
chooseBioCmirror()
biocLite("topGO")
biocLite("org.Hs.eg.db")
biocLite("GO.db")
biocLite("Rgraphviz")
library(topGO)

GOdata <- new("topGOdata", ontology = "MF", allGenes = geneList,annot = annFUN.gene2GO, gene2GO = geneID2GO)

Building most specific GOs .....
( 3893 GO terms found. )

Build GO DAG topology ..........
( 4356 GO terms and 5490 relations. )

Annotating nodes ...............
( 16722 genes annotated to the GO terms. )
|
四,基因富集分析
Fisher检验,通过2*2的列联表的进行计算。当然还有其他检验,比如KS,KS.elim。
—————-非差异表达基因—差异表达基因
注释到A通路——– 20 ———– 50
没有注释到A通路—- 1870 ——— 80
1
2
|
resultFisher <- runTest(GOdata, algorithm = "classic", statistic = "fisher")
allRes <- GenTable(GOdata,classicFisher = resultFisher, orderBy = "classicFisher", topNodes = 10)
|
根据orderBy的参数对象进行排序,得到结果如下
GO.ID Term Annotated Significant
1 GO:0032794 GTPase activating protein binding 14 2
2 GO:0015278 calcium-release channel activity 16 2
3 GO:0099604 ligand-gated calcium channel activity 16 2
4 GO:0005527 macrolide binding 19 2
5 GO:0005528 FK506 binding 19 2
6 GO:0001225 RNA polymerase II transcription coactiva… 1 1
Expected classicFisher
1 0.05 0.0012
2 0.06 0.0016
3 0.06 0.0016
4 0.07 0.0023
5 0.07 0.0023
6 0.00 0.0038
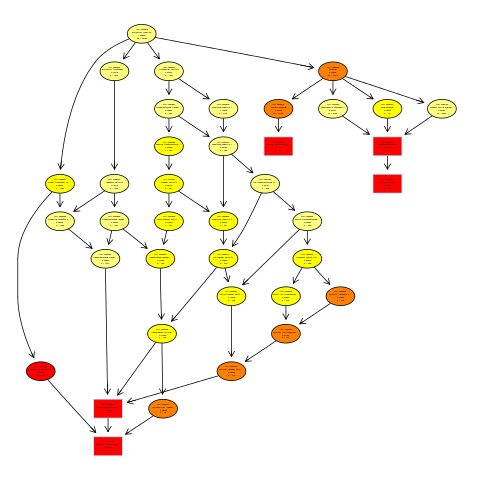
五,生成有向无环图(directed acycline praph,DAG)
1
2
3
|
svg("go.dag.svg")
showSigOfNodes(GOdata, score(resultFisher), firstSigNodes = 5, useInfo = 'all')
dev.off()
|

**参考: **
https://bioconductor.org/packages/release/bioc/html/topGO.html
http://wp.zxzyl.com/?p=182
https://www.biostars.org/p/102088/
####################################################################
#版权所有 转载请告知 版权归作者所有 如有侵权 一经发现 必将追究其法律责任
#Author: Jason
###################################################################

